Observability in DevOps – what we need to know?
Some time ago people didn’t talk a lot about observability. Today, it is considered one of the central components of the microservices landscape.
In this article we look at it in more detail – do read on to see what it is and why it is so important.
Why is observability so important?
As stated by the 2019 Accelerate State of DevOps Report, “delivering software quickly, reliably, and safely is at the heart of technology transformation and organisational performance. We see continued evidence that software speed, stability, and availability contribute to organisational performance (including profitability, productivity, and customer satisfaction).
Our highest performers are twice as likely to meet or exceed their organisational performance goals”.
But to develop software quickly and effectively one needs reliabale solutions not only to build it, but also to understand its current health. The latter can only be achieved by examining data the system generates: logs, traces, and metrics. In one word, by observability.
Observability in Kubernetes – a few facts
So, what is observability? Its main goal is to allow you to understand what exactly is happening across all the environments within your software to find and address any issues which may prevent the system from becoming efficient and reliable.
It helps you to:
- understand what services a request went through, and where were the performance bottlenecks,
- see how the execution of the request was different from the expected system behaviour,
- establish why the request failed,
- check how each microservice processed the request.
In the last few years, since cloud-native environments become more complex and widely used, observability became more critical then ever.
Observability, monitoring and analysis
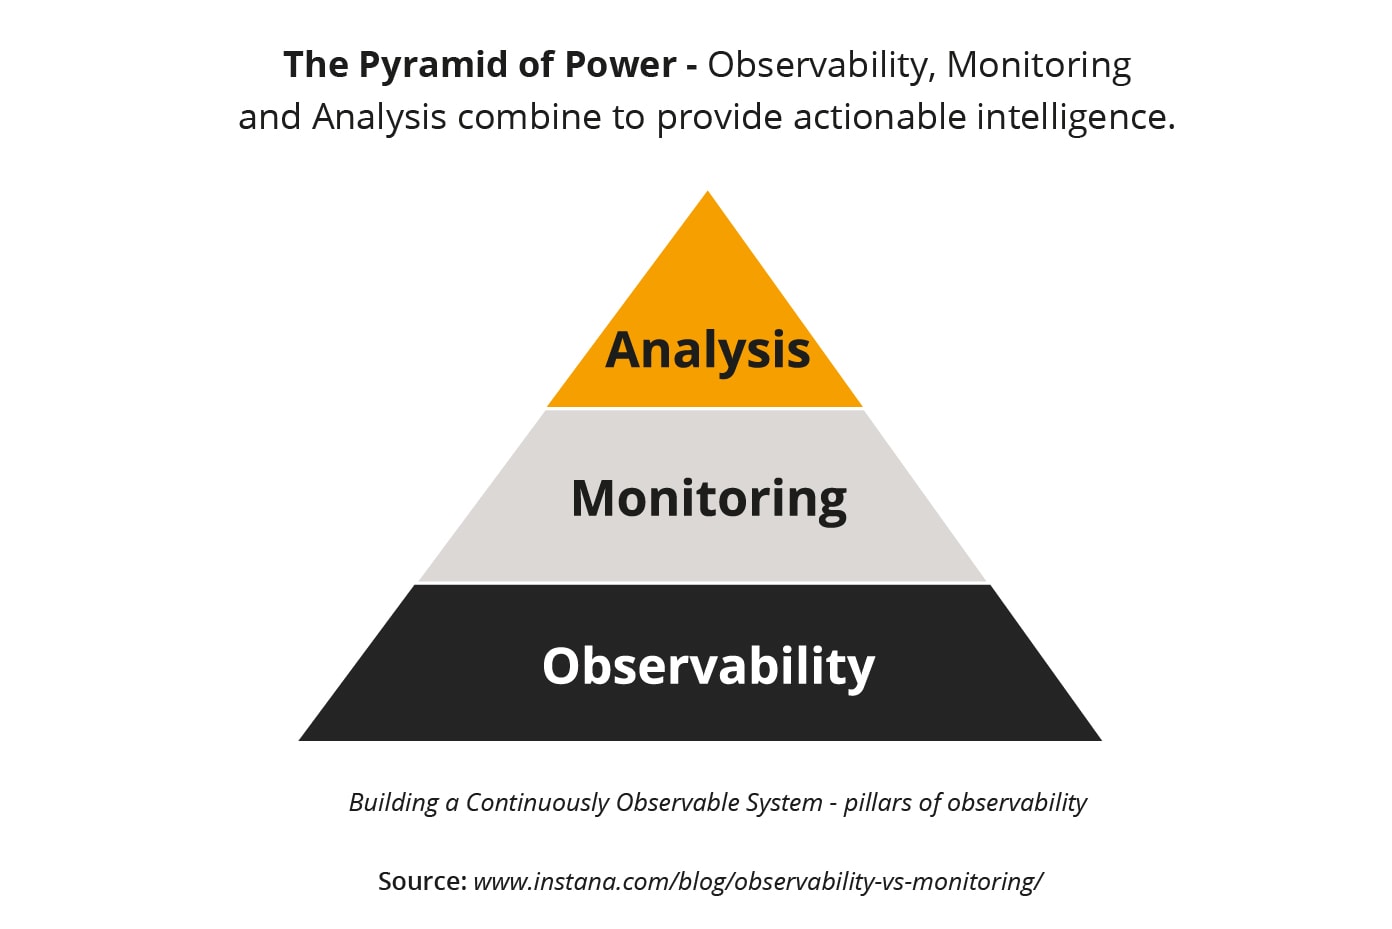
Despite the fact observability has recently become so important, there is still a lot to be said about it, and about how it differs from monitoring. The two terms are sometimes used interchangeably, which is not correct, as observability and monitoring are two different concepts.
Let’s investigate why.
As stated by the SRE book by Google, your monitoring system needs to answer two simple questions: what is broken, and why is it broken.
Simply put, it informs you that something is wrong, while observability enables you to understand the reason for why it is wrong. Monitoring is impossible without some level of observability.
Another component of an effective observability is analysis – when you’ve made your system observable and you collected data via monitoring, you need to conduct analysis, which will answer some of the most important questions about the system you are working on and its health.
Building a Continuously Observable System in DevOps: pillars of observability
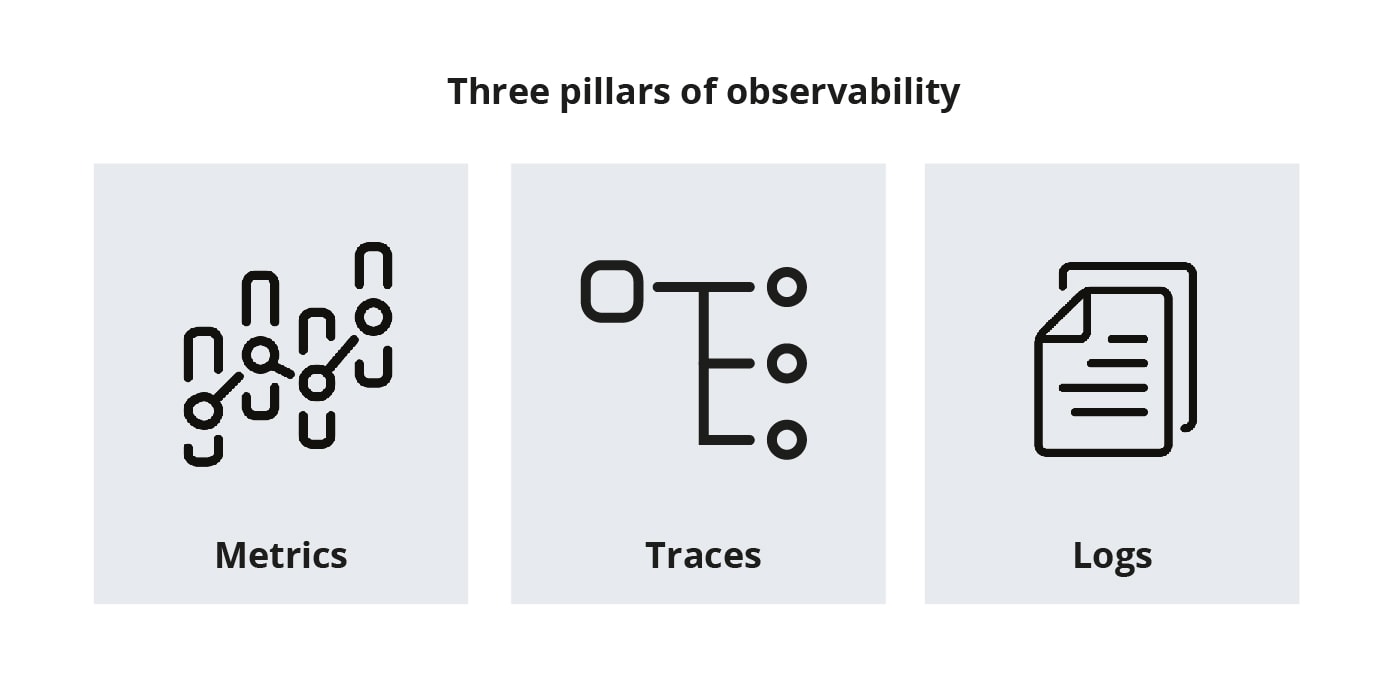
It may sound complicated but achieving observability doesn’t have to be difficult. To start with, concentrate on three key pillars that contribute to observability’s success:
Metrics
Metrics mean any data that can be aggregated over a period of time. It can come from many different sources such as cloud platforms, hosts or infrastructure. Metrics tell you for example how much of the total amount of memory is used by a method, or how many requests a service handles per second.
- A good example of a tool used for collecting metrics is Prometheus.
Tracing
Tracing shows activity of a transaction or a request inside applications. Capturing traces of requests and determining what is happening throughout the request chain allows you to find issues within the system and determine which components are responsible for errors.
Tracing is considered the most important part of observability implementation as it allows you to understand the actual reason of each issue.
- A popular tool used for tracing is Jaeger.
Logs
Logs are text records of discreet events that happened within a certain timeframe; they allow you to identify unpredictable behaviour in a system. For complex ecosystems with many components, such as Kubernetes, structured logging becomes very important.
It’s recommended to ingest logs in a structured way, for example using JSON format, so that logs become easily queryable.
The number of logs grow quickly, which make them difficult to manage and store. Fortunately, there are some tools which help to increase the effectiveness of logging. One of such tools is called OpenTelemetry – it can be used not only for logging, but also for metric collation and tracing.
- OpenTelemetry integrates with popular frameworks and libraries, such as Spring, ASP.NET Core, and Express. Other good tools used for logs analysis are Elastic and Loki.
Monitoring Kubernetes
Today, Kubernetes is the dominant platform for deploying and maintaining containers. But, as stated by Kelsey Hightower, Principal Engineer at Google working on Google’s Cloud Platform, “it is only as good as the IaaS layer it runs on top of. Like Linux, Kubernetes has entered the distro era”.
Even if your Kubernetes system does not show any errors, you may still encounter some issues outside of Kubernetes that can pose certain risk. Let’s see where else you can run into some problems while using Kubernetes:
Cloud provider/infrastructure layer
Some problems can be linked to the infrastructure of your cloud provider or to your on-premise environment. The remedy is planning your resources: you don’t want to use them all up before your Kubernetes cluster starts to scale. To do so, you must keep track of the quotas configured on the cloud provider and monitor the usage and costs of the resources.
If you are running your Kubernetes environment on-premise, monitoring all infrastructure components is also of key importance. A good solution for both cases is doing log file analysis which will allow you detect problems before they occur.
Operating system / Instance layer
Remember that you always need to keep your operating system up-to-dated. Always make sure you check the status of your Kubernetes services and automatically install all security updates as soon as they become available. A great source of information on the health check of your system are log entries.
Cloud platform layer
A lot of issues within Kubernetes environment are due to the growing number of applications while the infrastructure remains the same. A solution here is checking whether all nodes, pods, and deployments are schedulable and that you always plan for a reserve in case one of the nodes fail.
Application layer
Your Kubernetes may display no errors, but that doesn’t mean you don’t have any issues on the application layer. Fortunately, you can use real user monitoring (RUM) to check the behaviour and experience your users have when using your application.
This allows you to identify errors which you haven’t seen before, and which makes your clients abort certain actions when using your software.
Business layer
Technical things apart, even the best software cannot be successful if the customer doesn’t like it or cannot use it. This is why it is so important to link changes and new features within your application to business-related metrics such as revenue or conversion rate.
When releasing an updated version of your application, compare the metrics such as orders per hour to those from the previous version. If it looks the update has any negative effect, you may consider going back to the previous version, which was more successful.
Observability in DevOps and beyond
When creating new software, there are many things to take into account, observability being just one of them. By using right solutions, you can simplify the whole process, which will allow you to achieve better results in shorter time!
At Future Processing we focus on delivering the best solution for your particular business. Visit our website to see how we can take care of your software development process by helping you at every stage of it, its effective observability included.


