

Generally speaking, we can separate data into two different groups:
- internal data — generated by daily operations and interactions with business partners,
- external data — from macroeconomic, political, competitor-related, or even meteorological sources, etc.
Both groups are equally important and should not be underestimated — and that’s where Business Intelligence (BI) comes into play.
BI leverages software solutions to support faster data analysis and also adds a broader business perspective by delivering actionable information that fosters decision-making processes. It is focused around collecting data, isolating relevant pieces and then presenting everything in a user-friendly way, using graphs, charts, and dashboards. This helps put the business in context for easier comparison with the competition, and for measuring company performance from multiple angles.
In order to visualise what this all looks like in practice, we can use the DIKW diagram — a simple pyramid that represents the relationship between data and wisdom, step by step.
DIKW hierarchy

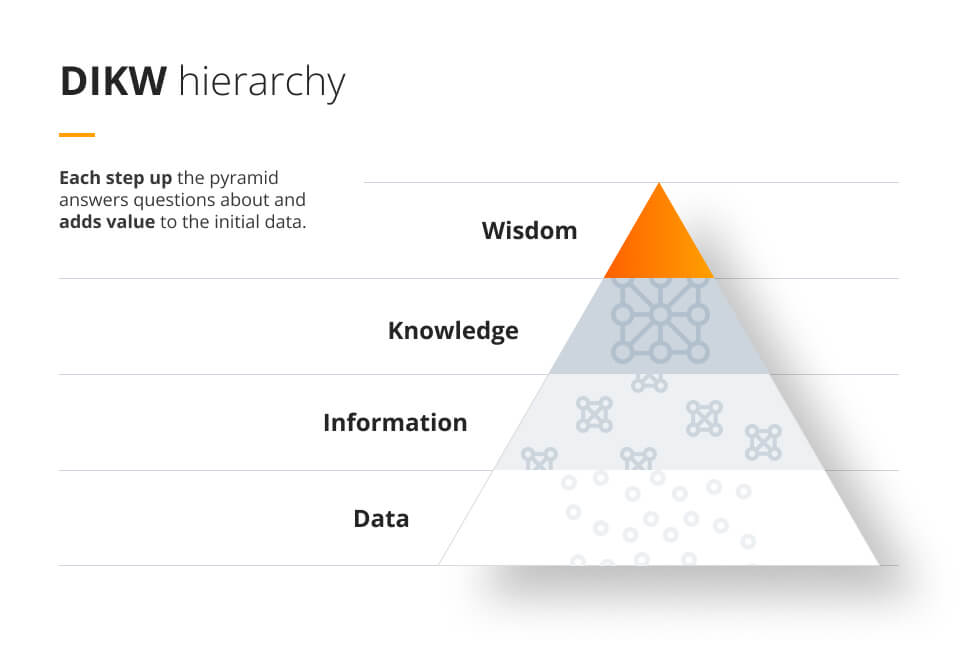
We analyse data to learn about observations, look for patterns, and gain knowledge so that we can use this to make the right calls later. Data alone, however, is not enough — much like a loose pile of bricks before they’ve been assembled and put together to actually create something. Those bricks are crucial and fundamental, especially if you’re trying to build a house, yet before they are put together, they’re about as meaningful as a set of random building blocks for kids, scattered about on the floor.
In very simple terms:
- Data includes raw facts, signals, figures, and observations, e.g. provided in a spreadsheet.
- Information includes categorised data arranged in a way that answers questions like “who”, “how much”, “when”, and “what”. Each piece of information has meaning and purpose.
- Knowledge is processed information put into context and backed by experience. It answers the question of how to apply information to achieve a certain goal.
- Wisdom is about developing good judgement and knowing what to do — including why we should do something and which option is the best option.
Business Intelligence (along with data science) helps you go from just having data to possessing wisdom, and this is something that is truly invaluable.
Connecting data with the right recipients
Data presentation is about conveying a message: in order to be understood correctly, it needs to reach the right recipient. Like with a foreign language, data cannot be correctly interpreted by someone who has never had any exposure or experience working with that language.
It is essential to determine and define the type of data consumers for each situation. Why? Because the very same elements of data can be presented in many different ways, depending on the audience.
For example, the estimated possibility of precipitation will take on a different form for the inhabitants of certain areas, for experts in hydroelectric power plants, as well as for pilots and farmers.
It is more or less the same situation within an organisation:
- C-level executives are normally interested in high-level and aggregated values, in order to gain a clearer and broader view of the overall situation.
- Mid-level management steps in whenever any anomalies occur, particular interests arise, and also if there are any problems that need to be solved. The investigation is then often delegated to a designated team.
- And finally, detailed and advanced analyses are carried out by business analysts who operate on the most granular level, and possess a wider variety of technical skills.
Incorporating storytelling in your data visualisation
Storytelling is one of the best and most universal means of teaching; and a lively one at that, both evocative and affecting the imagination. Leveraging the power of storytelling within Business Intelligence can transform the presentation of any kind of data into a compelling and easy-to-understand picture — even for someone without a technical background.
But how exactly do you tell a story with your data?
By creating a narrative using timelines, graphs, maps, charts, and more — everything you need to craft a story, you will attract the attention of target audiences, keep them focused, and make them truly grasp the meaning of the images that they see.
Data reports or visualisations should be arranged in a sequence to help guide the viewer and reveal information step by step. Ideally, if one step evokes a question like “why did this happen?”, the next step should provide an answer.
Of course, using too much data can be overwhelming, so you should only choose facts and figures that are relevant to the recipients and their problems or goals. Keeping in mind the context of your visualisations will allow you to always use adequate data and know when you need to add any written explanations.
Now that we have gone through an overview of the importance of audiences and storytelling in Business Intelligence, let’s move on to the most important part of this article, namely, how to incorporate BI into your business strategy!
How to kick off a BI project?
One of the best ways to design Business Intelligence processes and reports is during a specialised workshop — which, by the way, is something that we offer at Future Processing. Together with our business experts, technology professionals and consultants, we can come up with a BI solution that is tailored to your particular business needs and requirements.
Whether you decide to take part in our workshop or do the work completely on your own — there are always 5 main points that are at the core of any BI project. Here they are:
1. Define your metrics
Defining what needs to be measured, how it should be done and also how often — is key to seeing the complete picture for any context. You can even specify if an increase or decrease in your metrics is good or bad for your business, so that it’s all absolutely clear for stakeholders. The metrics included in your reports should be as meaningful as possible.
2. Design your calculations and aggregations
This is something that should be done in close cooperation with business experts, and it is essential to your metrics. Capturing any nuances hidden in your data assets requires a profound understanding and knowledge of your business processes, including the processes that run in more complex systems like ERP (Enterprise Resource Planning).
3. Design your reports
Deciding how to visualise the data for all of your audiences is terribly important. You may want to get some tips from an experienced BI consultant who is proficient in general data analysis, especially in terms of best practices for data reports. Why? Because designing a set of simple charts or heat maps may not be enough — you will also need more complex dashboards (collections of data visualisations) in order to tell a story — which I mentioned in the previous section.
4. Choose your tools
The market is overflowing with BI tools, and it’s definitely not the best idea to just choose random or the most popular ones. Every tool that you decide to use should match the needs of your organisation or a specific team — according to available skill sets and the general architecture around your data.
5. Set up rules and standards
Although each project can differ greatly, every organisation should have a set of rules and standards in place. This provides important guidelines for anyone interested and involved in the BI processes. It is also crucial in terms of standardising reports and avoiding any chaos or confusion.
This was just a brief guide on how to unlock the potential of your data and make good use of it. For more specific details — it’s always a good idea to get some advice from external experts and other sources. And if you’re reading this article, it may be a sign that our Future Processing workshops are something that would benefit you. Don’t hesitate to reach out to us if you want to kick off your BI in the right direction.

Related articles


